

Creating a histogram in Excel is an essential skill for data visualization. Whether you’re a student, analyst, or professional, understanding how to make a histogram in Excel can help you analyze data more effectively. A histogram displays the frequency of data points within specified intervals, making it a powerful tool for interpreting large datasets.
In this guide, we will provide a step-by-step tutorial on creating histograms in Excel, exploring various methods and tools. By the end, you’ll not only know how to make a histogram in Excel but also how to customize it for better visual impact and data insights.
Understanding the Purpose of Histograms in Excel
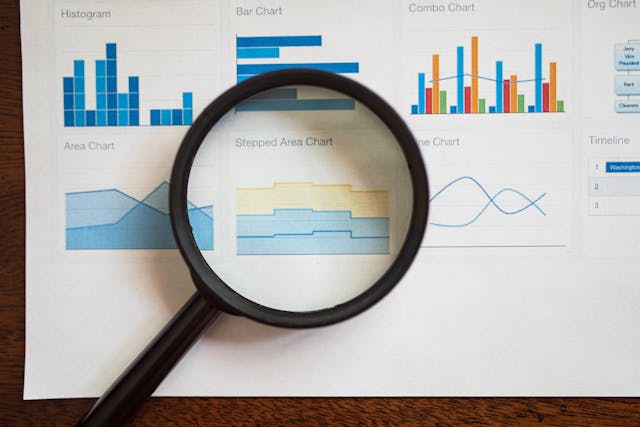
Before diving into how to make a histogram in Excel, it’s essential to understand what a histogram is and why it’s useful. Unlike a bar chart, a histogram groups data into intervals or “bins” and visualizes their frequency distribution.
Key advantages of histograms:
- Highlight Patterns: Easily detect data trends and outliers.
- Analyze Data Distribution: Identify clusters and gaps in your dataset.
- Make Informed Decisions: Gain insights into data that can drive strategies.
Preparing Your Data for a Histogram in Excel
1. Organize Your Dataset
To learn how to make a histogram in Excel, start by preparing your data. Ensure it’s structured in a single column or row and contains numeric values.
2. Define Data Ranges
Identify the range of data you’ll analyze and determine the number of bins required for accurate representation.
Pro Tip: For most datasets, 5-20 bins are sufficient to capture meaningful patterns.
Step-by-Step Guide: How to Make a Histogram in Excel
Step 1: Open Excel and Input Your Data
Enter your data into a column or row in Excel. For example:
| Data |
|---|
| 25 |
| 34 |
| 41 |
| 47 |
Having clean, numerical data is the first step in mastering how to make a histogram in Excel.
Step 2: Access the Data Analysis ToolPak
To create a histogram in Excel, you need the Analysis ToolPak:
- Go to “File” > “Options.”
- Navigate to “Add-ins” and select “Excel Add-ins.”
- Check the box for “Analysis ToolPak” and click “OK.”
This step is crucial in learning how to make a histogram in Excel using built-in tools.
Advanced Techniques for Creating Histograms
Using Formulas to Create Frequency Distributions
While the ToolPak automates histogram creation, formulas offer more control:
- Use
FREQUENCY()to calculate the distribution of data across bins. - Combine with Excel charts to build a custom histogram.
Mastering these techniques ensures flexibility in how to make a histogram in Excel for complex datasets.
Formatting Your Histogram for Better Visuals
Customize Your Chart
- Adjust bar colors to highlight key data points.
- Add gridlines for better readability.
- Label axes clearly to ensure your histogram is easy to interpret.
Formatting plays a vital role in improving your understanding of how to make a histogram in Excel.
Using PivotTables to Create Dynamic Histograms
For those handling large datasets, PivotTables can simplify the process:
- Organize your data into a PivotTable.
- Group data into intervals or bins.
- Visualize it using a PivotChart.
Learning how to make a histogram in Excel using PivotTables adds versatility to your skill set.
Automating Histograms with Excel Macros
Macros can save time when creating histograms:
- Record a macro to automate the process.
- Assign it to a button for quick access.
Automation ensures efficiency, especially when repeatedly learning how to make a histogram in Excel for different datasets.
Addressing Common Errors
Troubleshooting Tips
- Error: Histogram Bars Missing: Ensure your data contains no blank cells.
- Bins Not Displayed Correctly: Verify your bin ranges and adjust them.
Understanding these errors is essential when perfecting how to make a histogram in Excel.
Conclusion: How to Make a Histogram in Excel
Creating a histogram in Excel is a straightforward yet powerful way to visualize data. By following the steps outlined in this guide, you’ve learned how to make a histogram in Excel, customize it, and address common issues. Whether you’re analyzing sales data, student performance, or customer feedback, histograms will help you make data-driven decisions confidently.
Start practicing today and take your data visualization skills to the next level!
Share this:
- Click to share on Facebook (Opens in new window) Facebook
- Click to share on X (Opens in new window) X
- Click to share on LinkedIn (Opens in new window) LinkedIn
- Click to share on Reddit (Opens in new window) Reddit
- Click to share on X (Opens in new window) X
- Click to share on Threads (Opens in new window) Threads
- Click to share on WhatsApp (Opens in new window) WhatsApp